
May 24, 2022
Technology assets are amongst the most important intangible assets of enterprises. In June 2022, MARKABLES will launch a new set of comparable data, ratios and royalty rates to support the valuation of technology assets. This dataset comprises 3,000+ different cases of product technology, and another 2,800+ different cases of software. In this post, we give a first glimpse about what our users can expect from product technology comps.
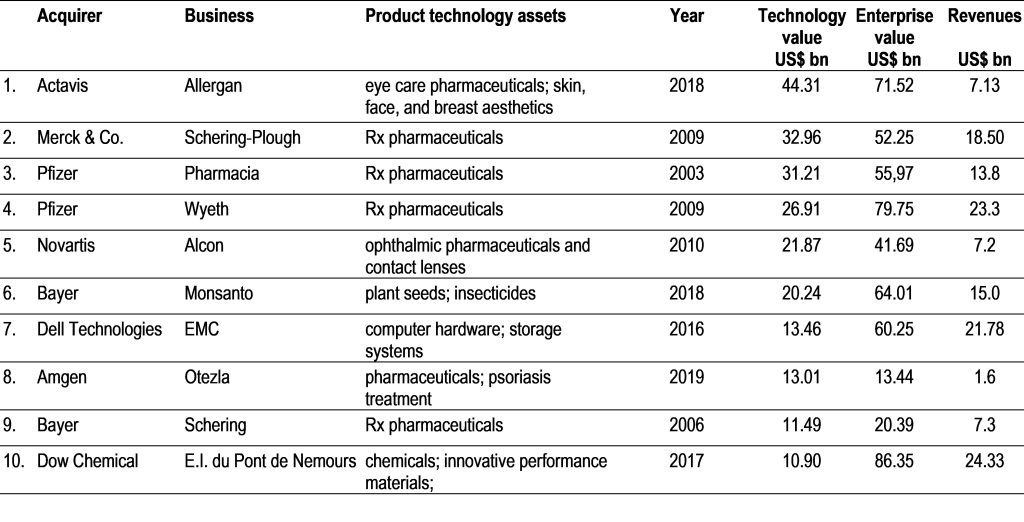
To begin with, we present a list of the ten most expensive technology portfolios we have on file. They have been acquired between 2003 and 2019, and their values range from 10.9 to as much as 44 billion US$. Our frontrunner is the tech portfolio of Allergan (eyecare and aesthetics) acquired by Actavis in 2018. Looking at the other cases on our Top10, we see pharmaceuticals, chemicals, and one IT hardware business.
The 10 tech portfolios account on average for 49% of enterprise value, and they show a stunning excess earnings margin (or royalty rate) of 55% on revenues (!), over a remaining useful life of 12.8 years. What we see here is the king’s class of hi-tech strategies, with expensive, long and risky R&D investments.
Get relevant and robust market comps for your valuation within minutes.

Churerstrasse 135
CH-8808 Pfäffikon SZ
Switzerland
