
August 15, 2014
Very often, the profit split method is used in the valuation of intangibles as a supplementary method to the royalty relief method. Under the royalty relief method, the subject intangible asset is valued by applying a hypothetical royalty rate from comparable license agreements between unrelated parties to the revenues generated under the asset. The present value of these royalties not paid or saved corresponds to the value of owning the intangible asset instead of licensing it.
The profit split method is a method to deduce how the profit generated from a business using a licensed intangible is split between licensor and licensee. The means to establish this split is the royalty paid by the licensee to the licensor. This royalty represents the share of the overall profit (before royalties) which is attributable to the intangible.
The profit split principle was found in the early days of licensing in the late 50s by Robert Goldscheider. He found that – in a number of similar license agreements with different territorial licensees – the royalty rate was 5% on net sales, and the licensee’s profitability in each case was close to 20%. Goldscheider assumed that there was a correlation between the profit of the licensee and the royalty rate it is willing to pay for the licensed intangibles. This is called the profit split principle, which basically says that licensor and licensee share cost and risk of their joint business through a profit sharing mechanism on the basis of the royalty rate.
Later, the profit split principle was modified to a “profit split rule of thumb” which stated that 25% of the licensee’s profits are typically the share to be paid as royalty to the licensor. Again later, this 25% rule of thumb was extended to a 20% – 33% percentage. It became a commonly used method to quantify or cross-check the appropriateness of royalty rates used in the valuation of IP, in transfer pricing, and in the quantification of infringement damages.
Over the years, the profit split method became subject of controversy for its simplicity. There were several attempts to provide empirical evidence for its validity, most notably by Goldscheider/Jarosz/Mulhern (2002), Kemmerer/Lu (2008), and Kemmerer/Lu (2011). The difficulty with these studies is that it was not possible to analyze the royalty rate and the profitability of a licensed business from the same set of data. Typically, researchers analyzed a set of royalty rates classified by industries, and a separate set of profit rates of (other) licensee companies in the same industries. On average, the 25% average figure was supported, but there were substantial deviations by industry around this figure.
The criticism went on and concentrated around the postulation that the 25% rate could at best serve as a starting point for a more sophisticated profit split analysis, and that the appropriate profit split percentage rate needs be established based on the facts and characteristics of each particular case. In early 2011, this criticism was confirmed by the US Courts of Appeals for the Federal Circuit (CAFC) in the much-noticed Uniloc ruling. Accordingly, “evidence relying on the 25% rule of thumb … fails to tie a reasonably royalty base to the facts of the case at issue.” The rejection of the 25 percent rule of thumb underscores the importance of considering the specific facts of a particular case.
However, the basic principle of profit split has never been questioned, saying that a royalty rate depends not only on the strength and importance of the intangible, but at the same time on the profits the licensee can expect to achieve from the use of the intangible. This principle of profit split has been widely used all over the world in the financial, tax and damage valuation of intangible assets.
In this context, MARKABLES analyzed the data of nearly 3,500 purchase price allocations (PPAs) from all over the world between 2004 and 2013 with the following objectives:
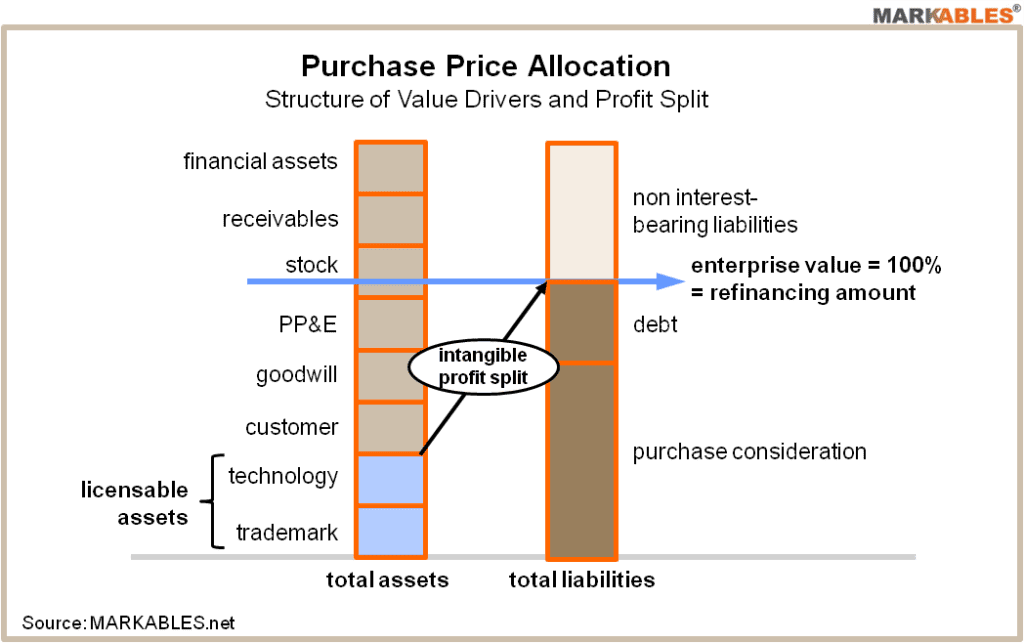
Purchase price allocations provide meaningful data to perform profit split analyses. Such data include the values of different intangibles which are often calculated by applying the royalty relief method, and the enterprise value of the acquired business. Values reported in a purchase price allocation represent the present value of future profits they are expected to generate. The ratio of a specific intangible to enterprise value is the profit split which this intangible is expected to contribute to total profits.
This concept is different to a profit split between licensee and licensor because it is an “inhouse” profit split which is not based on a market royalty rate between unrelated parties. However, it has two distinct advantages. First, it describes the (expected) profit contribution in a full ownership situation; hence it is much more meaningful for valuing ownership in intangibles or for establishing transfer prices for owned intangibles. And second, it allows – for the first time – to analyze profit split from one and the same dataset, and not from separate data.
Further, profit split as a basic valuation concept becomes fully evident from PPAs. The higher the profit of a particular business, the higher its purchase price, the higher the excess value of purchase price over net book value, the higher the value to be allocated to intangible assets and goodwill. Thus, profitability definitely has an influence on the value of the intangibles of a business. On the other hand, a business can have a temporarily low profitability but still a high enterprise value based on normalized profitability. Profit split valuation based on PPA data accounts for such normalized profits.
First, we have to remind the origins of the 25% rule of thumb. According to Goldscheider, the rule was originally established from licenses granted by consumer electronics company Philco Corp. to international licensees. These licenses included patents, trade secrets, trademarks, copyrights and some critical product components. Obviously, it was more of a business franchise than of a single property license. It was from this business license where the 25% rule of thumb originally emerged. Later, the rule was mostly used for singular technology or patents, but also for singular trademarks and copyrights. Still, it is important to remind the encompassing “business license” which was at the origin of the rule.
To test the 25% rule of thumb, we had to identify all categories of intangibles that can be licensed. By elimination, we omitted customer relations, backlog, favorable leases and non-compete covenants. These intangibles are typically not licensed between unrelated parties. All other categories of intangibles identified in the PPA were deemed to be licensable in principle. These licensable intangibles are the relevant base to analyze profit split.
As profit base, we choose the enterprise value of the acquired entity which represents the (present value of) all future profits the business is expected to generate. We define enterprise value as total purchase consideration for 100% of the shares, minus cash acquired, plus interest-bearing debt. [Enterprise value is smaller than total assets, by the amount of non-interest bearing liabilities assumed in the acquisition].The ratio “licensable intangibles to enterprise value” represents the share of future profits which will have to come from all licensable properties the entity owns and uses. Of course, the entity owns and operates additional intangible assets and intellectual properties which are not licensable, i.e. workforce, customer relations, cost synergies, growth plans, etc.
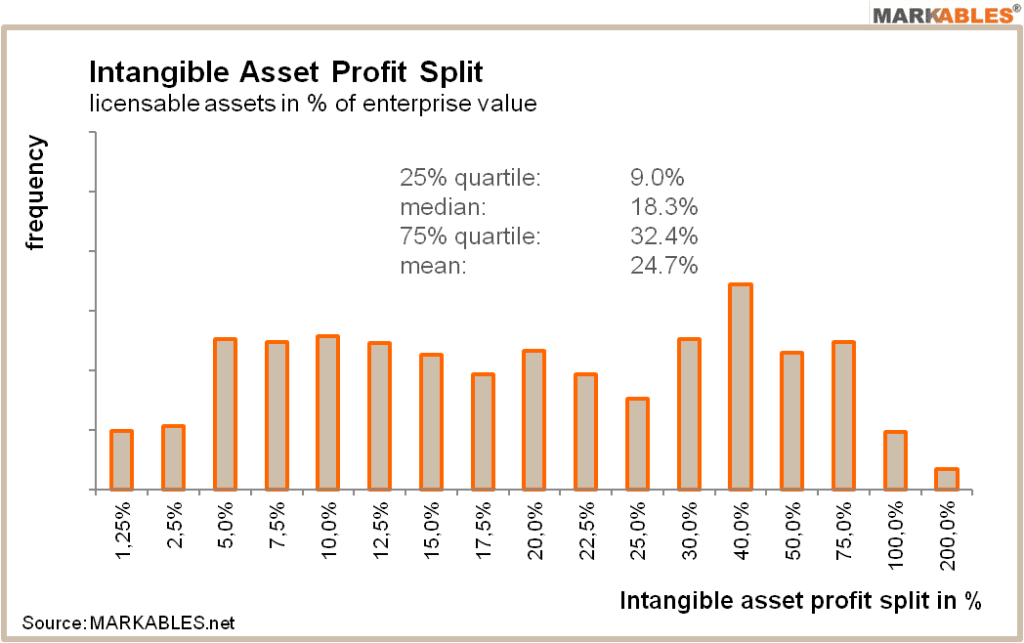
To make a long analysis short, the mean profit split of the licensable intangibles was 24.7% for the total sample. This figure seems to exactly confirm the 25% rule of thumb. A closer look at the frequency distribution of the single values suggests that the discovery of the 25% rule of thumb could have been a coincidence. There is no clustering of values around the 25% mean value, as a normal Gaussian distribution would suggest. Only 10% of the data points are located within the extended rule of thumb range from 20% to 33%. The median value is 18.3%, the 25% and 75% percentiles are 9.0% and 32.4% respectively.
The total range goes from close to 0% to well over 100%. The distribution of the single data points is not centered around its mean value 25%, but more or less flat over the total range of data. Hence, no empirical clustering of data around the 25% value confirms something like a “25% rule of thumb”, even no other rule of thumb. Instead, the analysis confirms what the CFAC stated in the Uniloc ruling. Accordingly, a profit split analysis must consider all facts and characteristics of the subject case and result in a case-specific profit split rate.
For clarification, we have to add two aspects. First, enterprise value in a purchase price allocation includes a premium to gain control over the majority of the shares of the business. This is different to the enterprise value of a running business and increases the denominator of profit split. On the other hand, this premium is allocated to intangibles and goodwill, thus increases the numerator. Both effect could – or could not – cancel out. Second, in a license negotiation between unrelated parties, often the licensee badly needs the licensed rights in order to do business, and he can get it only from the licensor. This unequal distribution of power between licensor and licensee may result in a higher price the licensee is willing to pay for the license, than what the licensor would be willing to pay himself to gain long-term control over the licensed property.
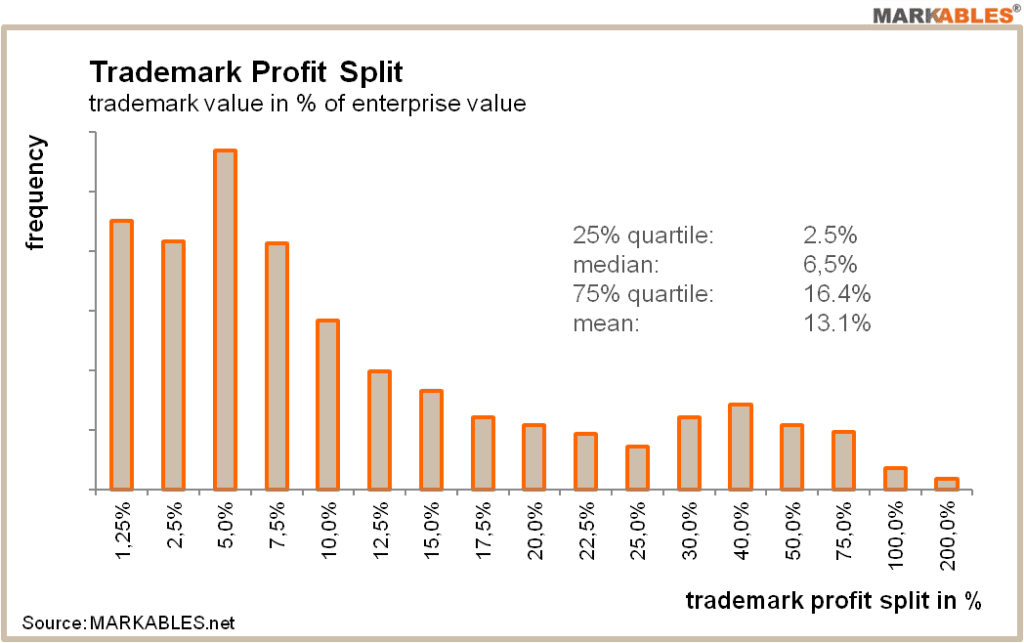
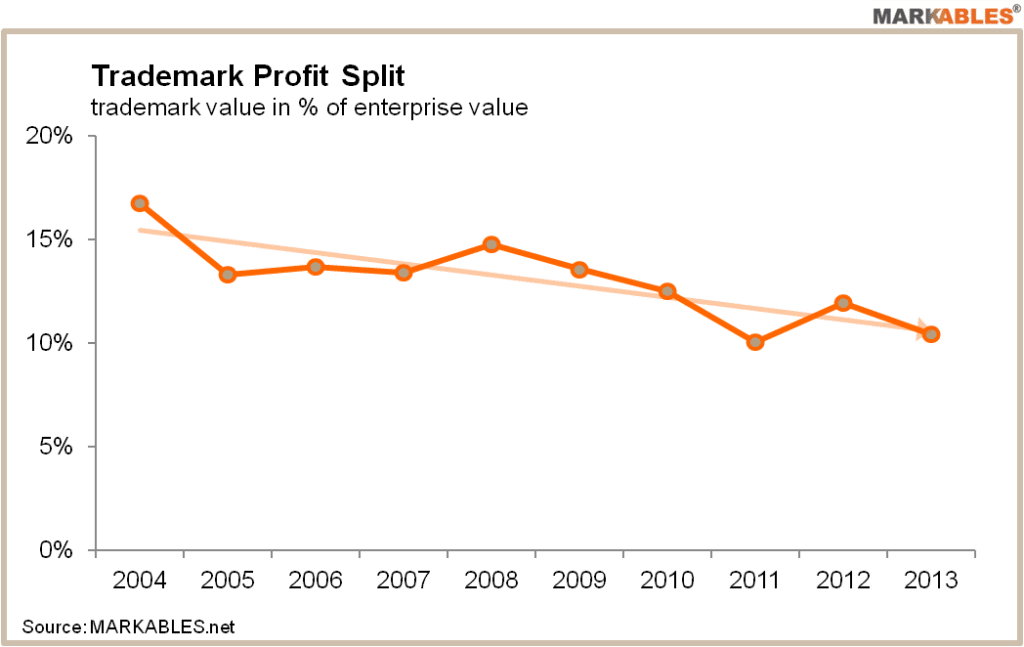
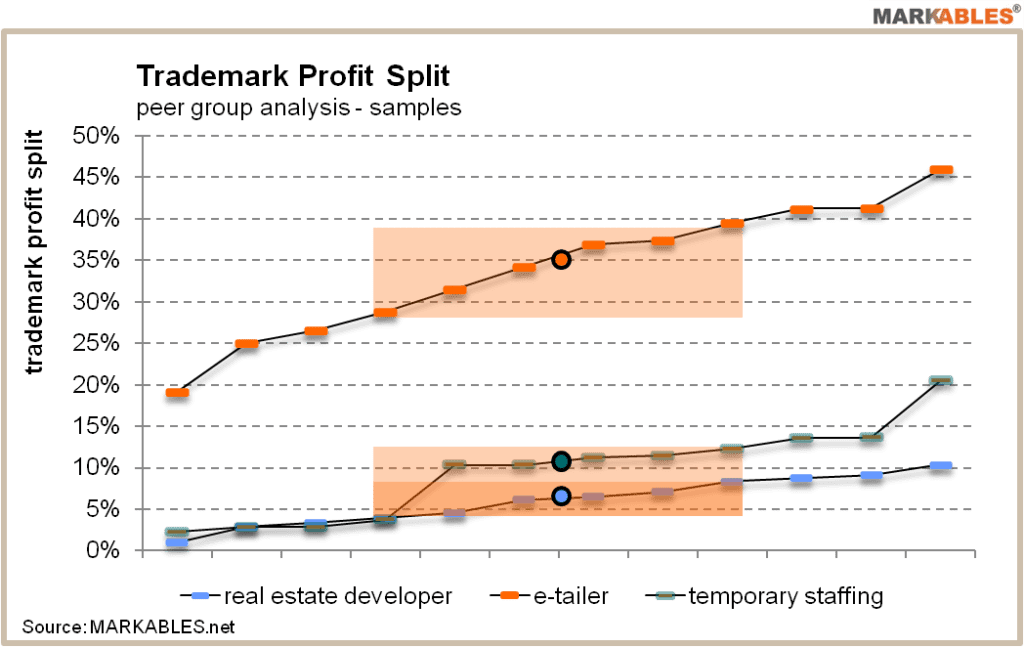
In a second step, MARKABLES analyzed that fraction of profit split that accounts for trademarks and brands. Obviously, trademark profit split has to be smaller than profit split for all licensable intangibles. Accordingly, the mean value of trademark profit split is 13.4%, the median 6.5%. The interquartile analysis finds the 25% and 75% values to be 2.5% and 16.4% respectively. The total range goes from close to zero to well above 100%. Interestingly, the mean value of trademark profit splits declines over time, from around 17% in 2004 to around 10% in 2013. One major reason for the decline of trademark profit split is that useful lives of trademarks were constantly reduced during the same period.
The analysis suggests a number of interesting and most relevant findings for trademark appraisers:
More details are illustrated in the charts below.
Get relevant and robust market comps for your valuation within minutes.

Herrengasse 46a
6430 Schwyz / SZ
Switzerland
